Cool Statistics on SmokingPipes

Log in

SmokingPipes.com Updates

Watch for Updates Twice a Week

PipesMagazine Approved Sponsor

PipesMagazine Approved Sponsor

PipesMagazine Approved Sponsor

PipesMagazine Approved Sponsor

PipesMagazine Approved Sponsor

shermnatman

Lifer
Jan 25, 2019
1,030
4,869
Philadelphia Suburbs, Pennsylvania
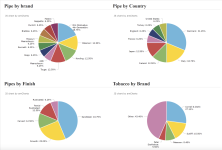
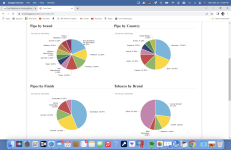
I never noticed this before; but, there is a butting on marked STATS on your SP account page.

If you click it, it will show you all sorts of cool graphs and charts about what you've ordered from them in the past.

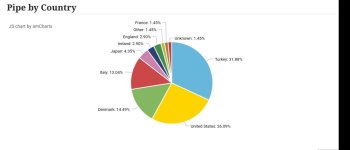
Look at the Pipe by Country pie-chart on the right - Perfect and equal distribution of pipe-makers from various counties!
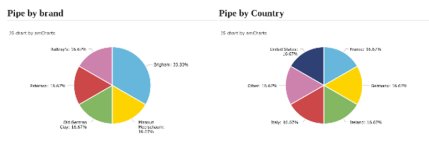
PIPE_CHART.jpg

Who knew... Your friend and humble narrator was such a well-balanced International Man of Pipes! LOL! - Sherm Natman
 
Dec 3, 2021
5,459
46,943
Pennsylvania & New York
I never noticed this before; but, there is a butting on marked STATS on your SP account page.

If you click it, it will show you all sorts of cool graphs and charts about what you've ordered from them in the past.

Look at the Pipe by Country pie-chart on the right - Perfect and equal distribution of pipe-makers from various counties!

View attachment 211393

Who knew... Your friend and humble narrator was such a well-balanced International Man of Pipes! LOL! - Sherm Natman

Your pie slices for "Pipe by Country" are so even!
 
  • Like
Reactions: shermnatman

brian64

Lifer
Jan 31, 2011
10,025
16,070
Look at the Pipe by Country pie-chart on the right - Perfect and equal distribution of pipe-makers from various counties!
I can barely read the blurry text, but I don't see Turkey on there.

Your pie should be at least half Turkey!
 

captpat

Lifer
Dec 16, 2014
2,389
12,421
North Carolina
I believe it only works for purchases from SP and not for example other vendors, estates, etc. As an example, my SP chart shows my collection comprised 54% Italian pipes, in reality, the total is 42%. This is due to the fact that only ~25% of my collection was purchased from SP.
 
  • Like
Reactions: litup
Nov 20, 2022
2,736
27,686
Wisconsin
I believe it only works for purchases from SP and not for example other vendors, estates, etc. As an example, my SP chart shows my collection comprised 54% Italian pipes, in reality, the total is 42%. This is due to the fact that only ~25% of my collection was purchased from SP.
Definitely true. My graph has about 1/2 of my pipe and tobacco purchases. It is still interesting.
 
  • Like
Reactions: shermnatman

wyfbane

Lifer
Apr 26, 2013
5,154
3,651
Tennessee
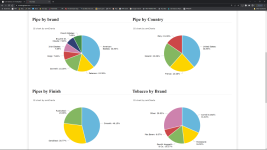
That is pretty cool. My power years of collecting are over, unless I win the lotto. My stats show me at 16.5% McClelland on the tobacco meter. ha ha! And I usually found my best deals on pipes elsewhere, so those stats are interesting, as well.

Screenshot (3).png