Age and Pipe Smoking

-
 Kevin Godbee
 - Dec 7, 2016
- 2 min read

Dr. Michael Garr, Ph. D. aka "Doc Garr"

We have lots of anecdotal information about whether pipe smoking is on the increase or decrease. And we have anecdotal information about what age groups are more likely to smoke a pipe. What we are lacking is systematic information about the age distribution of pipe smoking across a number of years.
I use the National Survey of Drug Use and Health (NSDUH) to provide some systematic information about pipe smoking. The NSDUH is a yearly survey that uses random sampling of the American population. The sample size varies each year but is typically around 55,000 respondents, which is a very large sample size. I examine the years in which the question of whether respondents smoked a pipe in the past month is asked. The NSDUH started to ask the question in 1999 and has asked the question every year since then.
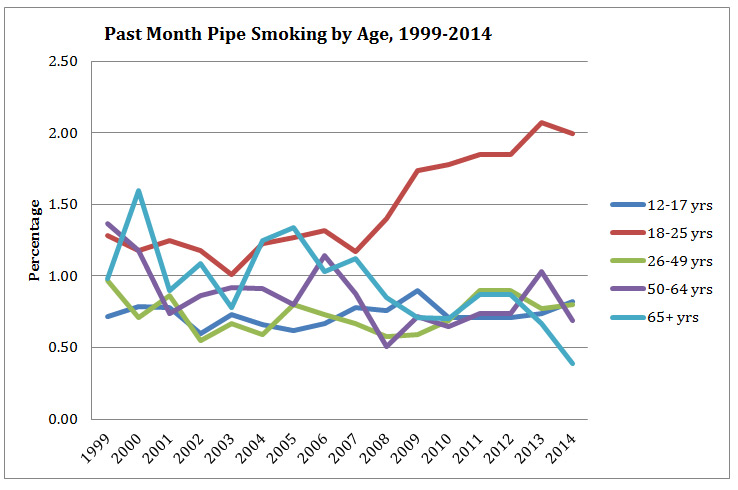
First of all, the percentage of the overall population who smoked a pipe in the past month does not change much over the 15 years. Between 1999 and 2014 past month pipe smoking varies from 0.9% to 1.2%. In 2014, it was 1%. So in a population of 320 million people, about 3.2 million smoked a pipe in the past month.
I look at five age groups, although the survey looks at 17 age groups. I do this to make the chart simpler to examine. The five age groups are 12 – 17, 18 – 25, 26 – 49, 50 – 64, and 65 or older, in years. Below is the chart of past month pipe smoking and age.

To simplify matters, I calculate the 1999 – 2014 percent change in pipe smoking for each age group.
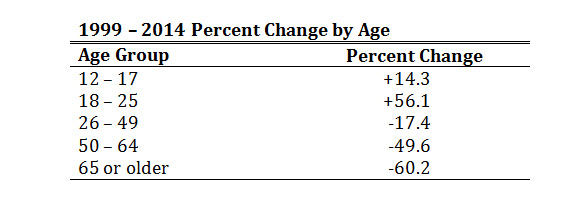
The -60.2% for the 65 and older age group may be an aberration. There was a precipitous drop in pipe smoking to 3.9% in 2014 from 6.7% in 2013. This was a large drop that I am assuming is somewhat erroneous. We will not know until the 2015 data becomes public. Probably it is somewhere closer to a decline of 30 – 35%.
Supporting the anecdotal information, we see that there is a rather large increase in past month pipe smoking by those ages 18 – 25. The youngest age group, 12 – 17, also saw an increase in pipe smokers. The older age groups all saw declines in the percentage of past month pipe smoking.
You can see in the chart that the 18 – 25 age group and the 65+ age group are fairly comparable. But starting in about 2005, the 18 – 25 age group significantly starts to increase and the 65+ age group starts to decrease.
We will have to wait to see what the future has in store for pipe smoking. We will have to wait and see what effect the FDA’s new draconian regulations on tobacco will have on pipe smoking. We pipe smokers are what the sociologist Max Weber terms a status group. We share a lifestyle. It appears that the younger generation is the carrier of this lifestyle into the future. Older pipe smokers must do their best to encourage this younger generation to continue our lifestyle. Hopefully, the increase in younger smokers will continue as they age into middle age and a new group of young adults will also take up the pipe.

"Doc" is currently president of The United Pipe Clubs of America and Pocono Intermountain Pipe Enthusiasts. In 2011 Doc won the national slow-smoke championship in Chicago and competed in the World Cup in Eindhoven, Netherlands, where he came in 69th out of 338 smokers. He has been a pipe smoker for almost 25 years. When he is not smoking a pipe, Doc is Professor of Sociology at Wilkes University. He also moonlights at El Humidor, Wilkes-Barre, PA, a tobacco store. |

Written by Kevin Godbee
5 Responses


Recent Posts
Welcome to The Pipes Magazine Radio Show Episode 619. Our featured interview tonight is with Corey Hays. Corey is a 26-year old pipe smoker that is part of our ongoing series of pipe smokers that are under the age of 30. He is from Mississippi and has never lived more than 20-minutes away from The Country Squire Tobacconist. He was influenced to smoke a pipe by reading J.R.R. Tolkien, C.S. Lewis, and 20th Century American History. He has been smoking pipes for three years. At the top of the show, Brian will have a tobacco review of a special tobacco that you could only get a pipe show.
Welcome to The Pipes Magazine Radio Show Episode 618. Our featured interview tonight is with AJ Khaled. AJ is a 22-year old pipe smoker that is part of our ongoing series of pipe smokers that are under the age of 30. Interestingly, he wasn’t initially inspired to take up the pipe by The Lord of the Rings, but more so by the author Tolkien himself while he was reading some of his other works. AJ has some really unique custom made pipes where he gave design specifics to and had them made by pipe makers Chris Askwith and Arcangelo Ambrosi. At the top of the show, we’ll have an “Ask the Pipemaker” segment with pipe artisan Jeff Gracik.
The other day, I was having a conversation with a friend about tobacco moisture. He tends to believe that a freshly opened tin presents the blender’s notion of the ideal moisture content for that tobacco, and that’s how it should be smoked. He’s not wrong, but as with so many things in our wacky world, it’s a little more complicated than that. When thinking about ideal moisture content for any specific tobacco, there are criteria for determining “correct” levels that can sometimes be at odds with one another. The proper moisture content for packaging tobacco, for instance, may not be the ideal moisture for smoking it. By way of background, let’s have a very brief and simplified look at the life of our beloved leaves once they’ve left the curing barns. Whole leaves or strips, the lamina of the leaves with the midrib removed, are boxed or baled quite dry for storage and transport. Before the tobacco can be worked, it has to be conditioned to a moisture level that allows it to be handled without shattering. There are various ways to accomplish this, but the end result is leaf that is pliable and easily manipulated without breaking. It can then be pressed into soft cakes that are cut into ribbons, or blended in stacks destined to be turned into plugs or flakes. At this point, it’s too moist to be considered “finished,” and has to go through a redrying stage. Since all of these steps may take place over a matter of months, or even years, tobacco can go through several conditioning/redrying cycles before it becomes the finished product. When it’s time to package a blend, the moisture level of the tobacco may have to be adjusted once again. If it’s too damp, there’s an increased risk of mold blooms, either within the sealed tin, or when spores are introduced after the tin is opened. This is never a good thing, so there’s a fairly hard upper limit to how much moisture is acceptable at this stage. If the leaf is too dry, on the other hand, things get troublesome in a different way. Dry, fragile tobacco can break into small fragments, even to the point of some of the leaf turning to dust during handling when packing the tins, and when those tins are jostled about during transport. This, again, is not ideal, establishing a lower limit for moisture content. Then, there’s the tobacco’s potential for aging to be considered. In order for these biological and chemical changes to take place, there has to be enough moisture to support the metabolic processes of the microorganisms involved in the various stages of fermentation that begin once the tin is sealed, and to allow for equilibration of various volatile byproducts of those processes. Finally, within the relatively wide window of upper- and lower-boundary conditions, there’s the moisture level for best smokability to be considered. That’s where things can get a little tricky. Different smokers have different preferences, and this is confounded by the fact that different types of tobaccos behave differently when their relative moisture content changes. To my palate, mixtures containing high percentages of latakia or oriental tobaccos generally tend to smoke and taste their best when on the dry side, while blends that predominantly comprise Virginia tobaccos like a bit more moisture to bring out their sweetness. But, this is a very general guideline, and I often find exceptions. Sometimes the same tobacco can be quite mercurial in its presentation depending on how damp or dry it is. The other day, I had a bowl of a latakia and Virginia-rich flake, fresh out of the tin with no drying time, and it was delightful, with the sweetness of the virginias taking center stage. A subsequent bowl, after a bit of drying time, rendered the orientals more forward, softened the sweetness, and polished the sharper edges of the latakia’s flavor profile. Same tobacco; two very different experiences. Additionally, things like ambient air temperature and relative humidity can play a significant role in the way any tobacco burns, but more importantly, how it tastes. (When it’s hot and humid, I generally abandon my latakia mixtures in favor of VAs and VA/perique blends.) If you haven’t experimented with this, it’s a fun thing to play with. Take enough tobacco out to fill your next bowl, and let it sit out for a while – anything from a few minutes to an hour or two, depending on the climate. (For those in tropical zones, this might actually have the opposite result. Yes, there really are people in some parts of the world who keep their tins sealed to keep moisture from getting in, not out.) See how it tastes in comparison to fresh from the tin. When tobacco is on the dry side, a gentle hand when packing is advised. What about when we rediscover an opened, long-forgotten tin whose contents have become all but desiccated? Can it be brought back to life? While the tobacco won’t return 100% to its best form, as some of the volatile components from aging will be lost to the ether, it can certainly be made smokeable again, and might yield some pleasant surprises. Of course, first give it a try as is, and see what it’s like. There are a couple of good ways to bring the moisture level up, and some not so good ways. I don’t recommend spraying it with water, putting apple or potato slices in the tin, or any other drastic measures. Tobacco takes up moisture much more slowly than loses it, and it will take time for all the strands to reach equilibrium, so a gentle approach is advised. My favorite is to put the leaf in a small bowl, cover the bowl with a damp cloth or paper towel, and set a plate on top. Keep an eye on it over a day or two, checking the progress periodically and ensuring the cloth remains damp. This also works […]
Welcome to The Pipes Magazine Radio Show Episode 617. Our featured guest tonight is Jon David Cole. JD is the Owner/Tobacconist at The Country Squire in Jackson, MS, and the accompanying online store. We’ll have JD and Brian talking about what’s new at the store and in the business in general, including Scandinavian Tobacco Group’s acquisition of Mac Baren. At the top of the show, Brian will discuss pipe shows, pipe show organizing, and the Las Vegas International Pipe Show.
Welcome to The Pipes Magazine Radio Show Episode 616. Our featured interview tonight is with Gabe Hall. Gabe is a 23-year old conservative Californian from Bakersfield that is involved in politics part time. He is part of our newer ongoing series of pipe smokers that are under the age of 30. Both his story of starting pipe smoking, and his smoking routine are a little bit different than the usual story. At the top of the show we will have an Ask the Tobacco Blender segment with Jeremy Reeves. Jeremy is the Head Blender at Cornell & Diehl, which is one of the most popular boutique pipe tobacco companies in the USA.
Ok, the old Pundit is gonna say this only once. Well, maybe twice: It’s beach time! Some of my happiest pipe-smoking memories were created on the back deck of an original Pawleys Island, S.C., beach house. Listening to the waves dash and flop were pure music, highlighted by the squealing laughter of children frolicking along the beautiful Atlantic shoreline. Now, before you go bellowing about shark attacks, Pundit has his No. 1 Rule about sharks and warning flags, even if no flags are flying on an empty stretch of coastline. Having fished the surf many a day and evening, and even occasionally on a high pier resting on mighty shell-encrusted pilings and stretching out over the aqua-tinted waters, it became apparent that predators with large, sharp teeth prowled menacingly close to splashing bathers So, Pundit Beach Rule No. 1, ankle-deep wading and strolling, only. Make quick swims if it is not too windy, and never if menacing fins are seen cutting the water like the bow of a battleship. Rule adjustments might be needed for kiddies and exuberant beach paddlers in the family. Another necessary adjustment in the rule is no swimming alone. OK, beach lesson over. You don’t have to take Pundit’s word. Check out sea-going pipe-smoking experts: Herman Melville, who knew a thing or two about ferocious whales, and Sir Ernes Henry Shackleton, a famed adventurer who took on frozen seas. No sharks, but the message loudly proclaims oceans harbor many a menace, some large in body with huge teeth and some just frozen solid mountains of floating ice. And while checking up on Pundit, you might enjoy Chuck Stanion’s Herman Melville’s Literary Pipes February 4, 2022, in Pipe Line and his masterful story on the Shipwreck of Shackleford’s Endurance, also in Pipe Line. Now back to Pundit’s time on the beach, in a chair at sunrise on a screened-in deck, seas dancing, pipe in hand. Vacations today seem to be all hurly-burly, hurry, scurry, and worry. Back when a seaside deck beckoned, I packed not only fishing equipment, and some clothes, but also a shoulder bag full of pipes and enough tobacco to survive a voyage with Sir Shackleton. Each morning, noon, and night watch was accompanied by different pipes and different blends. Pipes ranged from Dunhills, Cavicchis, Ser Jacopos, Ashtons, Petersons, and Savinellis. Blends tended to be simple: aromatics and English containing various additives, of course. On rare occasions, I made a Pundit blend, which combined English with Latakia and aros with Virginia. Pundit blends were meh, but there were Cornell & Diehl, Capstan, Samuel Gawith, Three Nuns, Wessex, and the late lamented McClelland, plus a couple of others to save the rare moments. Pundit beach time was also a time for testing THESIS (taste, heat, enjoyment, strength, issues, satisfaction). There is but one way to do this properly and that is to employ a new cob pipe. Cobs give a good overall THESIS, sort of the cheaper version of precious sea-borne meerschaums. Cobs are, in a way, landlocked meers, and provide an excellent idea of how a particular blend will emerge. Ok, enough of experimentation. We are on a beach vacation, right? Observing the sun rising over an orange-lit horizon with a pipe and a cup of coffee is simply put, enchanting. Sun and ocean seem to merge for a brief moment in a blur of beauty. You can find yourself at the beach, leaning back in a chair, letting the morning-salted breeze sweep over you whilst you puff gently in between sips. Ahh, that’s a morning on the beach. There is nothing quite like it in the Pundit’s mind. And now for a couple of thoughts from real experts on sea adventures: Herman Melville is an American author, poet, and novelist best known for “Moby Dick.” But let us not forget Cornell & Diehl’s Melville at Sea tobacco series of blends: Billy Budd, Redburn, and John Marr, other noted works from Melville’s pen as well. It is better to fail in originality, than to succeed in imitation. He who has never failed somewhere, that man cannot be great. Failure is the true test of greatness—Herman Melville. Then there is Sir Ernest Henry Shackleton. Pipes, as mentioned by Chuck in his excellent piece on the great explorer, who relied on his pipe when the going got rough. Through endurance we conquer― Ernest H. Shackleton And finally, a Pipe Smoker of the Past cannot go without mentioning: Sir Arthur Conan Doyle, born May 22, May 1859, and died July 7, 1930. If you are struggling to identify Sir Doyle in your mind, then you might be too young to be reading this. Of course, he is the prodigious author of the great detective Sherlock Holmes novels. Holmes and his drama are must-reads on any pipe-smoker’s novel list. ‘Nuff said! It is an old maxim of mine that when you have excluded the impossible, whatever remains, however improbable, must be the truth—Sir Arthur Conan Doyle.


Totally surprised by the 18-25 year-old cohort. I would have expected a slight increase. Older folks may fade in pipe smoking for unrelated health reasons, but the drop surprised me too. One of my pipe friends who lives in NYC/Queens/Sunnyside and has a daughter in her twenties, commented in a recent phone call that pipe smoking has really become fashionable again, and since fashion is frequently a function of the young, I guess this refers to the 18 to 25 year-old cohort.
Not really that surprising altogether, really. I was talking about this very thing with a local shop owner and he stated that pipe smoking is at a plateau overall. Myself, I have not smoked my pipes much over the past few years due to several factors. I’m picking them back up more now.
Nice data. It is surprising. “Fashion” could be a factor but I have yet to see even the slightest hint in anything I have seen. Then again,… I never have been the trendy type. I do suspect that there has been some strong influence from the “Lord of the Rings” type movies and “Wizards” and the such. There is an entire “cult” if you following this sort of thing. I do not. Still new,… renewed,… to pipe smoking,… I see a lot of Church Wardens. If you dig enough,.. many are the full wood stems and not just some briar version. I am a fan of the Church Warden and there are some fine long stem briars offered. It was my love of Church Wardens that led me to the whole Wizard “angle” of pipes. At any rate,… my 2 cents.
It would be interesting to relate the 18-25 data to the soaring price of cigarettes. Seems to me that the price of cigarette smoking, increasing like it has in the last ten years, may explain the 18-25 data.
Cortez,…. as a cigarette smoker as well,… 2 and 1/2 cartons can be rolled with the roll your own “pipe tobacco” and tubes for $23.00 U.S. (1# and 3 boxes of tubes). They had to change the cut of the cigarette tobacco I believe and now call it pipe tobacco. Otherwise,.. that same 2 1/2 would run around $150.00 in Ohio. But yes,… you do have a good point and I am sure that it factors in as well.